3D source code visualizer flies 2.5 million lines of code at 120fps
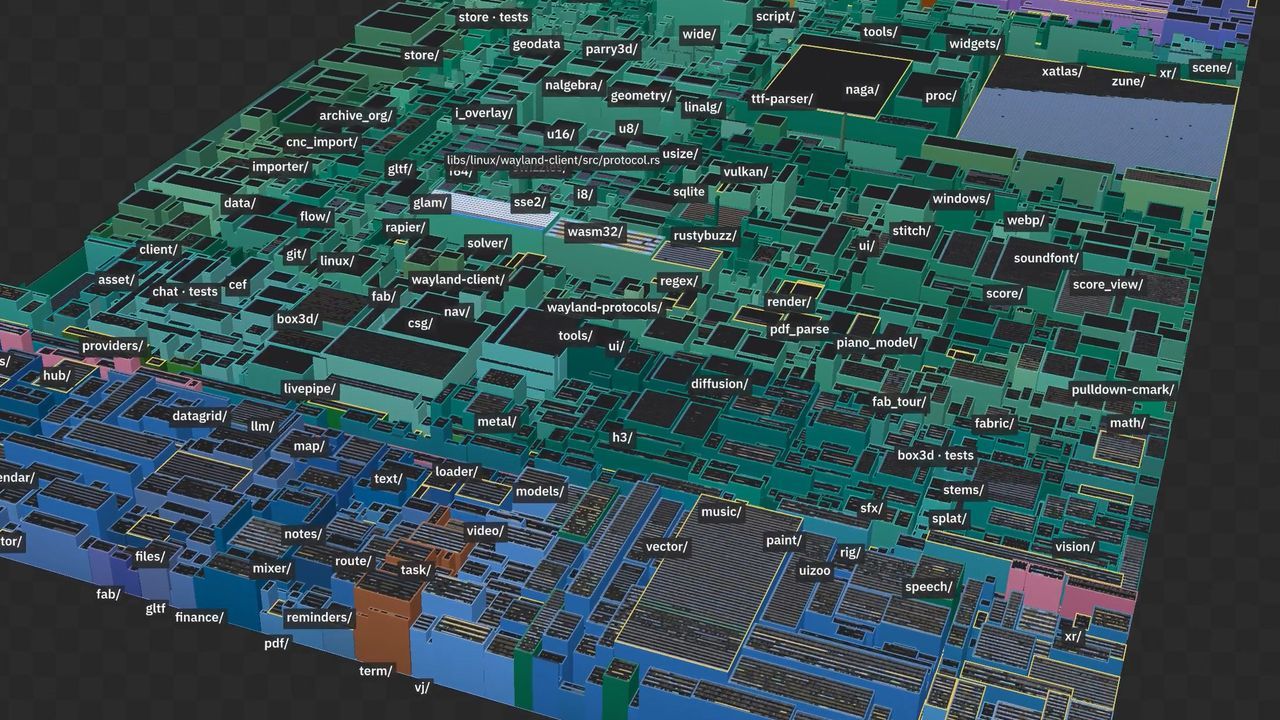
We all carry that deeply ingrained piece of tech lore: the timeless notion that a computer system, particularly a Unix system, is fundamentally brilliant. This sentiment echoes in the memory of software pioneers, like the visualization tools developed in the late 90s, which sought to turn abstract data into tangible, three-dimensional space. While the dream of viewing files in 3D has always existed in digital imagination, the barrier wasn’t just conceptual—it was often a limitation of computational horsepower.
Today, a developer is pushing those boundaries, taking the concept of spatial data visualization and applying it to the often-hidden world of source code. The result is a bespoke 3D flyable visualizer that manages to handle massive volumes of code with astonishing fluidity, proving that the theoretical potential of visualization is far more real than ever.
The creator of this tool, Rik Arends, has engineered a system capable of exploring 2.5 million lines of source code with remarkable ease, achieving frame rates of 120+ FPS. This performance level transforms the experience of navigating complex code, allowing users to move through the data rather than just scan it.
But the innovation extends beyond mere speed. Arends tackled the massive memory demands associated with visualizing such enormous datasets. Initially, loading the visualization required a staggering 21 GB of RAM. Through clever application of indexing and streaming compression techniques, he successfully reduced the memory footprint to a far more manageable 3.5 GB, demonstrating a mastery of efficiency that is truly noteworthy.
The ambition doesn’t end there. Arends has also demonstrated the system’s potential by attempting to load the entire source tree of Chromium, consisting of 51 million lines of code, within a mere 60 seconds.
While the visual experience of traversing the code is undeniably engaging—a fascinating spectacle of geometry and logic—the discussion naturally shifts to practicality. Critics point out that the visual aspect, while fun, may lack immediate commercial utility. For true power users, the real opportunity lies in adding temporal elements, allowing users to track changes across source files over time, or developing 3D tracking for visualizing complex dependencies.
Commercial solutions already exist, such as CodeCharta, which offers 3D visualization of changes and hotspots, yet Arends’ creation pushes the limits of what is currently feasible. Despite the practical questions, the motivation behind the project remains simple and powerful: “because I could.” The ongoing debate is whether this groundbreaking tool will evolve into a practical necessity or remain an impressive feat of technical ingenuity.
Buy on Amazon
Credit